Investment Appraisal — The Dilemma
You can picture it. Your old car is in the garage undergoing its annual service when you notice the mechanic walking towards the waiting area. He sucks in his breath through clenched teeth and shakes his head.
"She's knackered, I'm afraid. Cost you more than she's worth to fix her up."
It couldn't have come at a worse time. You have been thinking about setting up a small taxi business serving the local villages now that you have retired from your career as a Business Analyst. But suddenly the idea requires a significant investment: do you buy a new car and start the business, or abandon the idea and live happily on your pension?
You think the business could work. But thinking that it could work and demonstrating that it makes financial sense are two rather different things. If you are going to invest a substantial amount of money, you would like to know whether you are likely to get that money back — and how long it might take.
Before deciding whether an investment is attractive, we need evidence about its likely costs, benefits and financial return.
That is the purpose of investment appraisal.
The Financial Case
Investment appraisal provides a collection of techniques for examining the financial consequences of an investment. A Business Analyst may encounter these techniques when contributing to a business case, comparing solution options or helping decision-makers understand whether a proposed change represents worthwhile use of organisational resources.
The calculations themselves are not especially difficult. The more important skill is understanding what each calculation tells us — and what it does not.
We will use several terms throughout this article:
- Cost-Benefit Analysis (CBA) — compares the expected costs of an initiative with its expected benefits. Where those benefits can be expressed financially, the resulting cash flows can also be used to calculate payback.
- Payback Period — the time required for the accumulated financial benefits of an investment to recover its initial and ongoing costs.
- Discounted Cash Flow (DCF) — adjusts future cash flows to reflect the time value of money.
- Discount Rate — the rate used to convert future cash flows into their present values. Organisations may determine this using their cost of capital, required return, risk assumptions or other financial criteria.
- Discount Factor — the multiplier used to convert a future cash flow into its value today.
- Present Value (PV) — the value today of a future cash flow after discounting.
- Net Present Value (NPV) — the sum of the present values of the expected cash inflows and outflows associated with an investment.
- Internal Rate of Return (IRR) — the discount rate at which the NPV of the investment becomes zero.
- Weighted Average Cost of Capital (WACC) — an organisation's weighted average cost of obtaining finance from its different sources of capital. It may be one factor used when determining an appropriate discount rate.
The Business Analyst does not need to become an accountant. But anyone contributing to a business case should understand what these measures mean well enough to interpret them, question the assumptions behind them and explain their implications.
Start with Payback
Let's return to the taxi business.
The first question is a very practical one:
How long will it take to recover the money we put into the business?
To answer it, we need to identify our expected costs and income and place them against the years in which they occur.
The Taxi Project
We're thinking of buying a suitable estate car. The purchase price for the model in our example is £26500.
There are also several costs involved in becoming licensed and ready to trade. For our example, we will assume initial start-up costs of £600.
Then there are the recurring costs: fuel, servicing, maintenance, cleaning and other operating expenses. We estimate these at £7500 in the first year and assume that they will rise by 10% each year.
Insurance is another significant expense. We will begin with £700 and assume an annual increase of 5%.
Finally, there is the reason for starting the business in the first place: income. We estimate earnings of £17000 in Year 1, growing by 15% each year as the business becomes established.
These figures are estimates. That matters, and we will return to it later. For the moment, however, assume that they are reasonable enough to use in our financial appraisal.
Try It — Cost-Benefit Analysis and Payback
Use the figures in the taxi project above to consider the cash flows for Years 0 to 4. Year 0 contains the investment needed to get started. Subsequent years contain the costs and income generated by operating the business.
The Annual C/F shows the net cash flow for that year. The Cumulative C/F shows our overall financial position after adding each year's result to everything that has happened previously.
| Year 0 | Year 1 | Year 2 | Year 3 | Year 4 | |
|---|---|---|---|---|---|
| New Car | |||||
| Startup Costs | |||||
| Running Costs | |||||
| Insurance | |||||
| Earnings | |||||
| Annual C/F | |||||
| Cumulative C/F |
The point at which the cumulative cash flow moves from negative to positive tells us that the original investment has been recovered. That gives us the payback period.
Try the exercise again using New Values. The arithmetic changes, but the reasoning does not: identify the cash flows, calculate the annual position, accumulate the results and find the point at which the investment has paid for itself.
Can We Calculate Payback More Precisely?
Saying that an investment "pays back in Year 3" may be sufficient for a high-level comparison, but sometimes we want a better approximation.
Suppose £7,395 remains unrecovered at the end of Year 2 and the expected net cash inflow during Year 3 is £13,367. If we assume that the Year 3 cash flow arrives reasonably evenly throughout the year, the approximate monthly rate of recovery would be:
£13,367 ÷ 12 = £1,113.92 per month
We can then divide the outstanding amount by that monthly cash flow:
£7,395 ÷ £1,113.92 = 6.64 months
On those assumptions, payback occurs roughly six and a half months into Year 3.
Be careful with apparent precision. A result such as 6.64 months looks very precise, but it is still based on estimated future cash flows and an assumption that the year's cash flow arrives evenly. More decimal places do not make the underlying assumptions more certain.
Payback Has a Problem: Time
Our simple payback calculation has answered an important question, but it has ignored something equally important.
£1 received several years from now is not economically equivalent to £1 available today.
Money available today can be invested, used elsewhere in the organisation or earn a return. Future money also carries uncertainty. Consequently, financial appraisal commonly recognises the time value of money.
Payback tells us when the numbers recover the investment.
It does not tell us what those future cash flows are worth today.
Discounted Cash Flow
Discounted Cash Flow, or DCF, allows us to express future cash flows in present-value terms.
The Discount Rate
To do that we need a discount rate. The rate represents the required return or opportunity cost against which future cash flows are being assessed. In practice, an organisation may derive it from its cost of capital, investment policy, the risk of the proposal or a combination of factors.
The Business Analyst would not normally invent this rate. It will usually come from the organisation's finance function or investment policy.
The Discount Factor
Once we know the discount rate, we can calculate a discount factor for each future period:
Discount Factor = 1 ÷ (1 + Discount Rate) ^ Years
For example, at a discount rate of 5%, the discount factor for a cash flow received two years from now is approximately:
1 ÷ (1 + 0.05)² ≅ 0.907
A £1,000 cash flow received in Year 2 would therefore have a present value of approximately:
£1,000 × 0.907 = £907
The further into the future the cash flow occurs, the greater the effect of discounting.
Back to the Taxi Project
Let's repeat the appraisal, but this time take the time value of money into account.
Our taxi project again requires a car costing £26500 and initial start-up costs of £600.
First-year running costs are approximately £7500, increasing by 10% each year, while insurance begins at £700 and increases by 5%. Expected Year 1 income is £17000, growing by 15% per year.
This time, however, we will discount the future cash flows using a rate of 11%.
Does the investment still recover its cost within our four-year appraisal period once the future cash flows have been converted into today's values?
Try It — Discounted Cash Flow
| Year 0 | Year 1 | Year 2 | Year 3 | Year 4 | |
|---|---|---|---|---|---|
| New Car | |||||
| Startup Costs | |||||
| Running Costs | |||||
| Insurance | |||||
| Earnings | |||||
| Annual C/F | |||||
| Discount Factors @ 11% | |||||
| Present Values | |||||
| Cumulative C/F |
Notice what discounting has done. The underlying business has not changed. The taxi earns and costs exactly what our assumptions say it will. What has changed is the way we value money that will not be received until the future.
Present Value
The Present Value (PV) of a future cash flow is its value expressed in today's terms.
The calculation is straightforward:
Present Value = Future Cash Flow × Discount Factor
If a future annual cash flow were £13,367 and the applicable discount factor were 0.864, its present value would be approximately:
£13,367 × 0.864 ≅ £11,548
The cash flow is still expected to be £13,367 when it occurs. Discounting does not alter the amount of cash. It allows us to compare that future amount with money available today.
Net Present Value
Once all the relevant future cash flows have been discounted, we can combine them with the initial investment to calculate the Net Present Value (NPV).
NPV = Present value of future net cash flows − Initial investment
More generally, where there are several positive and negative cash flows, NPV is the sum of all those discounted cash flows, including the initial investment.
An NPV greater than zero means that, using the chosen discount rate and the assumptions in the appraisal, the investment is expected to generate value above the required return represented by that rate. An NPV below zero means that it does not meet that financial threshold.
NPV can therefore be useful when comparing investment options, but it should not be treated as an automatic project-selection rule. Projects may differ in risk, scale, strategic importance, regulatory necessity, resource demands and non-financial benefits.
A positive NPV is evidence in favour of an investment.
It is not proof that the organisation should make it.
Internal Rate of Return
The Internal Rate of Return (IRR) approaches the same investment from another direction.
Instead of choosing a discount rate and calculating the resulting NPV, IRR asks:
What discount rate would make the NPV of this investment exactly zero?
That percentage is the investment's internal rate of return.
An organisation can compare the IRR with its required rate of return or other investment criteria. If the IRR is comfortably above the organisation's required return, the proposal may appear financially attractive. As always, however, the result depends upon the cash-flow assumptions and should be considered alongside other decision factors.
Three Ways to Find IRR
There are several ways of finding or approximating the IRR.
1. Graphing It
Calculate the NPV using several different discount rates and plot the results. The point at which the NPV curve crosses zero indicates the approximate IRR.
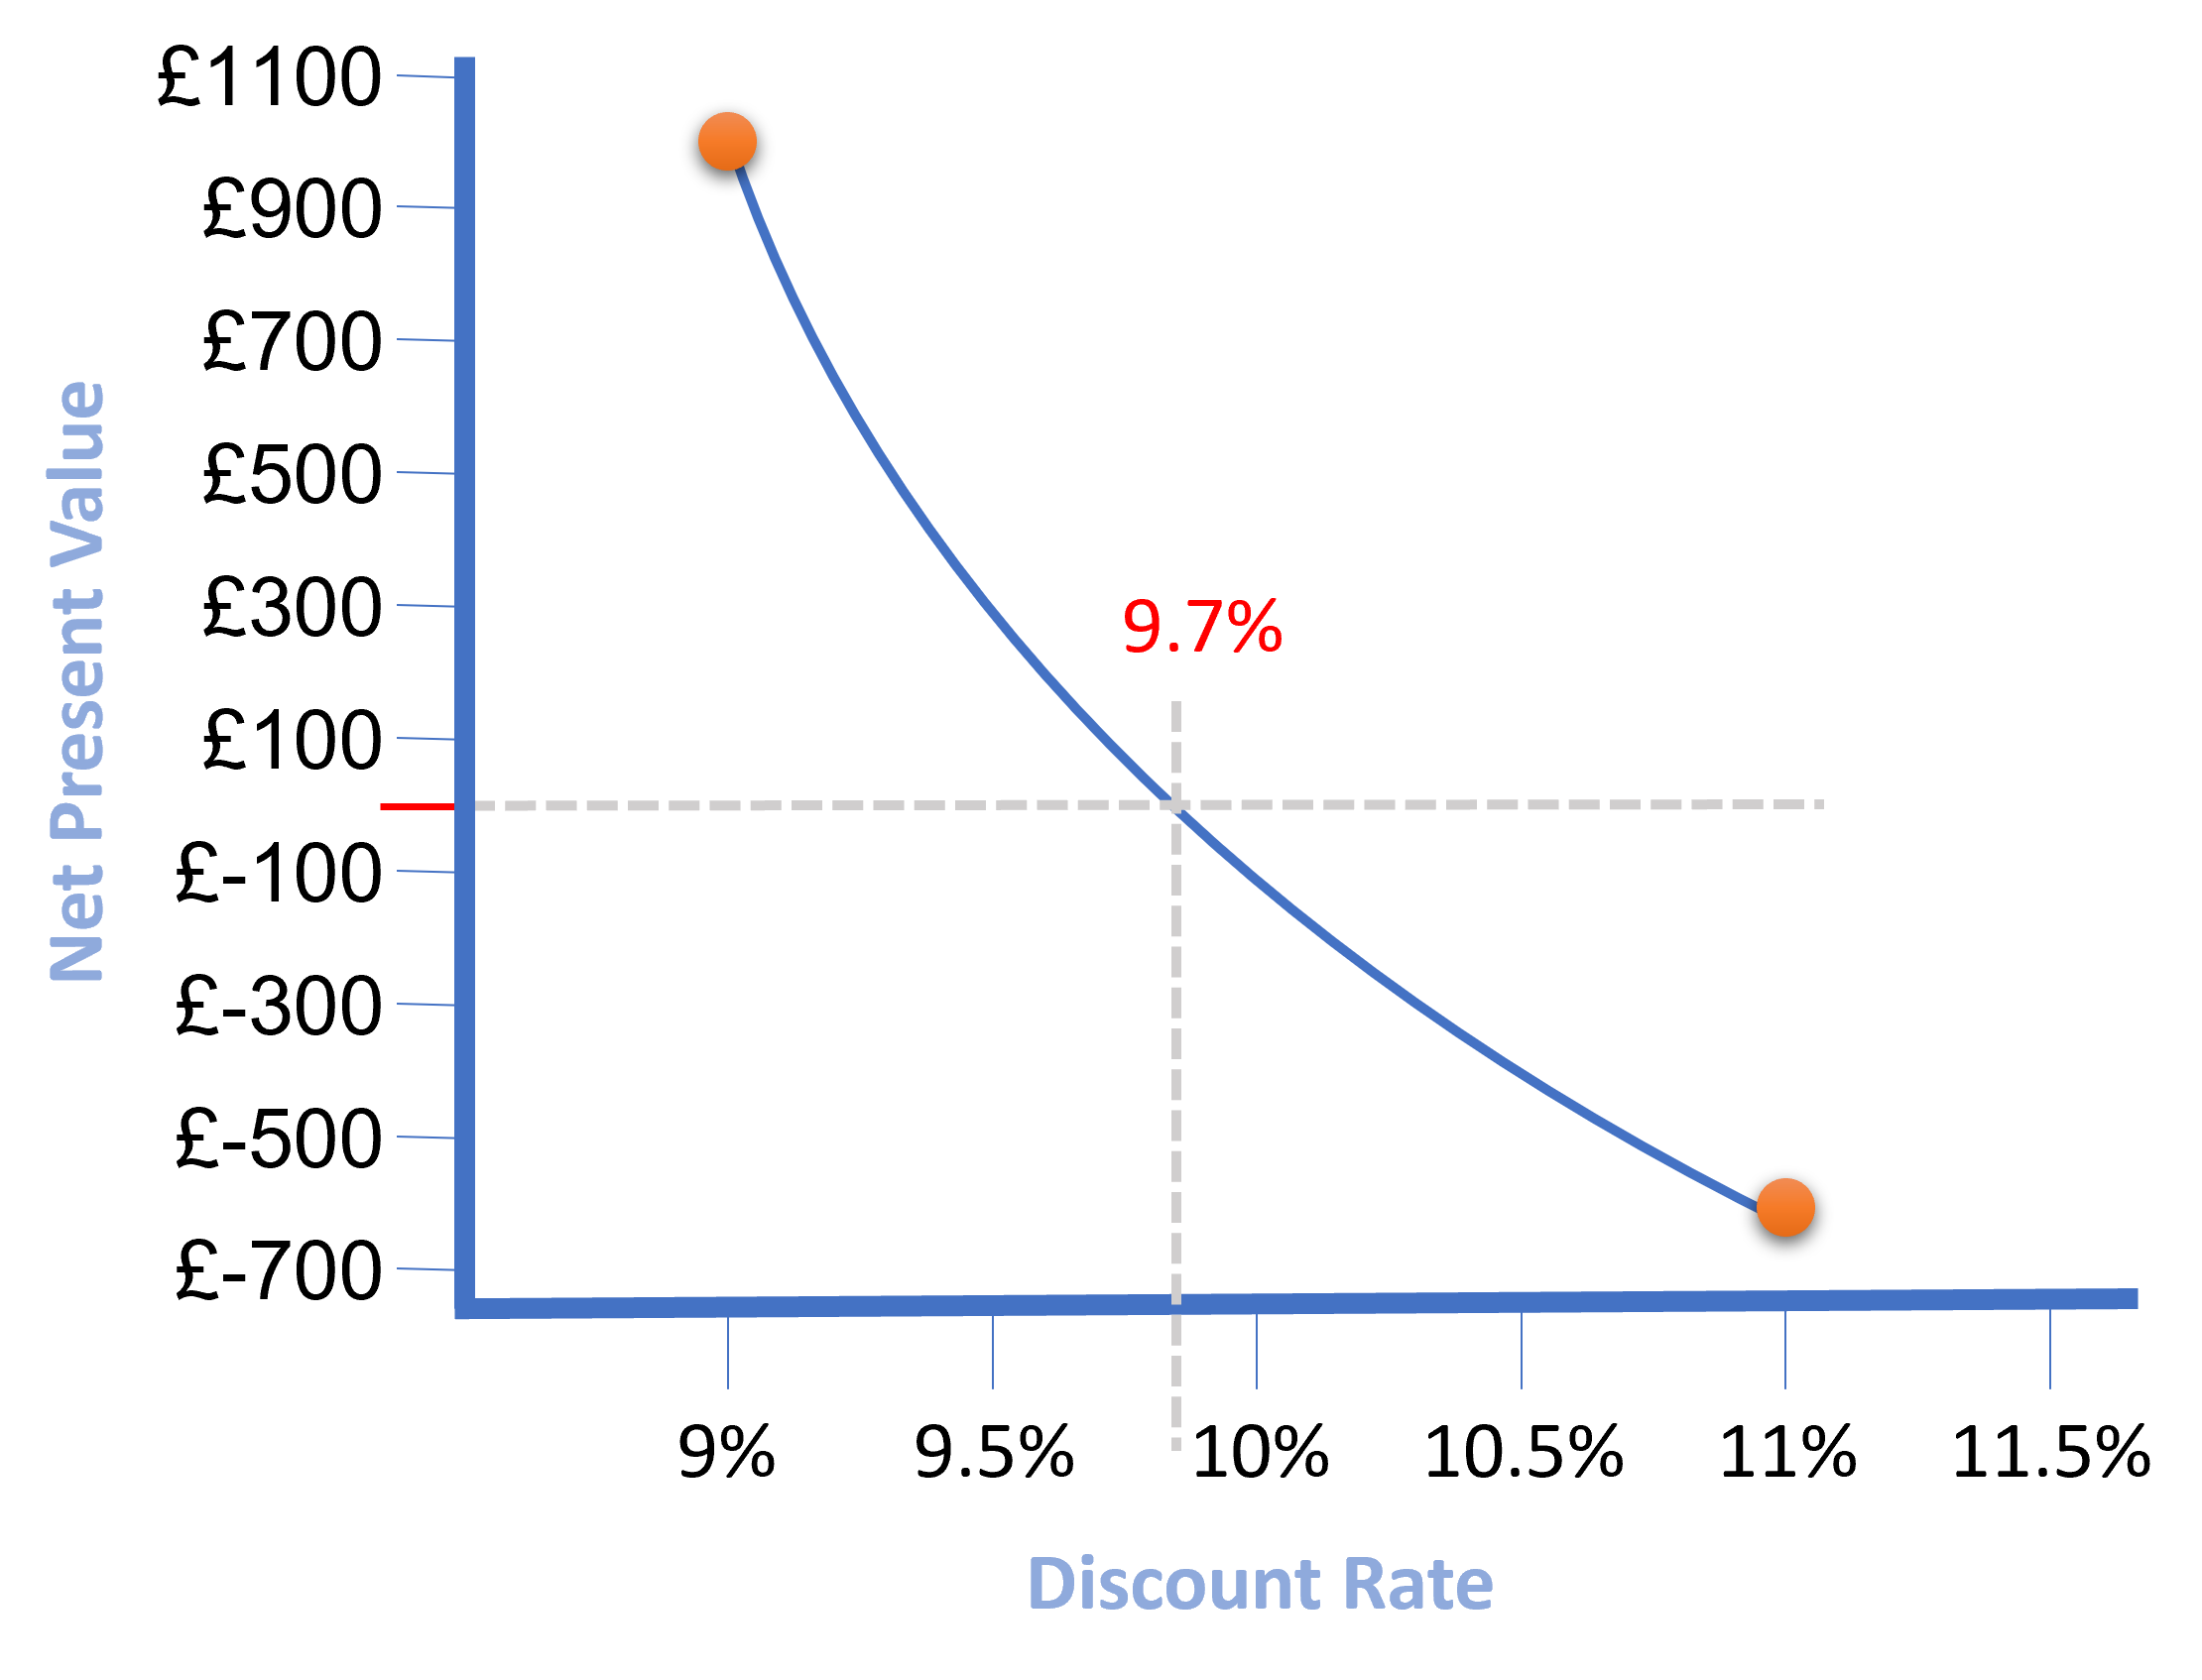
This is not the most precise method, but the graph can be useful when explaining the relationship between discount rate and NPV to stakeholders.
2. Using Spreadsheet Functions
Spreadsheet applications provide functions for calculating rates of return. The commonly encountered variants include:
- IRR — calculates the internal rate of return for a series of cash flows occurring at regular intervals.
- XIRR — performs a similar calculation where cash flows occur on specific, potentially irregular dates.
- MIRR — Modified Internal Rate of Return, which allows separate assumptions about the financing cost and the rate at which positive cash flows can be reinvested.
For most practical business analysis work, the calculation will be performed by financial software or a spreadsheet. Understanding what the result means is usually more important than calculating it manually.
3. Approximation by Interpolation
It is nevertheless useful to understand how IRR can be approximated.
Suppose a 9% discount rate gives us an NPV of +£1,022 while an 11% rate gives us an NPV of −£589. The IRR must lie somewhere between the two.
| NPV | |
|---|---|
| Discount rate 9% | +£1,022 |
| Discount rate 11% | −£589 |
A simple linear interpolation gives:
              IRR ≅ 9 + [1022 ÷ (1022 + 589)] × (11 − 9)

              IRR ≅ 10.27%
This gives an approximate IRR of 10.27%. A spreadsheet or financial application would normally be used when greater accuracy is required.
IRR also has limitations. Unusual cash-flow patterns can produce misleading results or more than one possible IRR. It should therefore be treated as one financial indicator rather than a universal measure of project quality.
The Calculation Is Not the Decision
Investment appraisal is powerful precisely because it turns assumptions about costs and benefits into something that can be examined. But that can also create a danger: once a calculation produces a number, the number can appear more certain than the assumptions from which it was created.
There are several reasons for caution.
Costs and Benefits May Be Wrong
The appraisal depends upon identifying the relevant costs and benefits and estimating them reasonably accurately. Omit an important cost, exaggerate a benefit or make an optimistic assumption about growth and the resulting financial case may look considerably better than reality.
Our taxi example assumes that earnings will grow as the business becomes established. That may be reasonable, but it is still an assumption about future customer behaviour.
The Discount Rate Is an Assumption Too
DCF may be more sophisticated than simple payback, but its results depend upon the discount rate being used. A different rate changes the present value of future cash flows and therefore changes NPV.
This is another reason why the assumptions behind an appraisal should be visible rather than hidden inside a spreadsheet.
Some Benefits Resist a Price Tag
Not every important outcome can sensibly be converted into pounds and pence. Customer satisfaction, employee experience, safety, regulatory compliance, reputation, resilience and strategic capability may all influence a decision.
Attempts can sometimes be made to assign financial values to such benefits, but doing so does not magically make those values objective.
An Appraisal Is Not a Project Budget
A financial appraisal is an evaluative tool. Its purpose is to help determine whether an investment appears worthwhile.
Its costs and benefits are forecasts. They should not automatically be treated as the approved project budget or as commitments about exactly what the project will cost or deliver.
Payback Can Favour the Short Term
Suppose Project A pays back after two years while Project B takes three. A decision based purely on payback would favour Project A.
But what if Project B generates substantially greater benefits during Years 4, 5 and 6? A simple payback comparison can overlook value occurring after the payback point.
Financial Value Is Not the Only Value
Some projects must be undertaken because of legislation, safety, contractual obligations or operational necessity. Others may establish capabilities the organisation will need in the future.
Investment appraisal helps decision-makers understand the financial dimension of those choices. It does not remove the need for judgement.
Investment appraisal turns assumptions into numbers.
Good business analysis makes sure decision-makers can still see the assumptions behind the numbers.
What Should the Business Analyst Take Away?
The Business Analyst's contribution to investment appraisal is not simply to perform calculations. It is to help ensure that the financial case represents the proposed change fairly and transparently.
That means understanding where the costs and benefits came from, challenging assumptions, recognising uncertainty, distinguishing financial measures from the wider business case and making sure decision-makers understand what the figures actually demonstrate.
The principal techniques each answer a slightly different question:
- Cost-benefit analysis asks whether the expected benefits justify the expected costs.
- Payback asks how long it takes to recover the investment.
- Discounted cash flow recognises that future money is not equivalent to money available today.
- NPV expresses the net value created by the investment in present-value terms at a chosen discount rate.
- IRR expresses the discount rate at which the investment's NPV becomes zero.
Used together, these techniques can provide valuable evidence for a business case. Used mechanically, they can create an illusion of certainty.
Before recommending an investment, ask:
The numbers say it works — but have we included everything that matters to the decision?